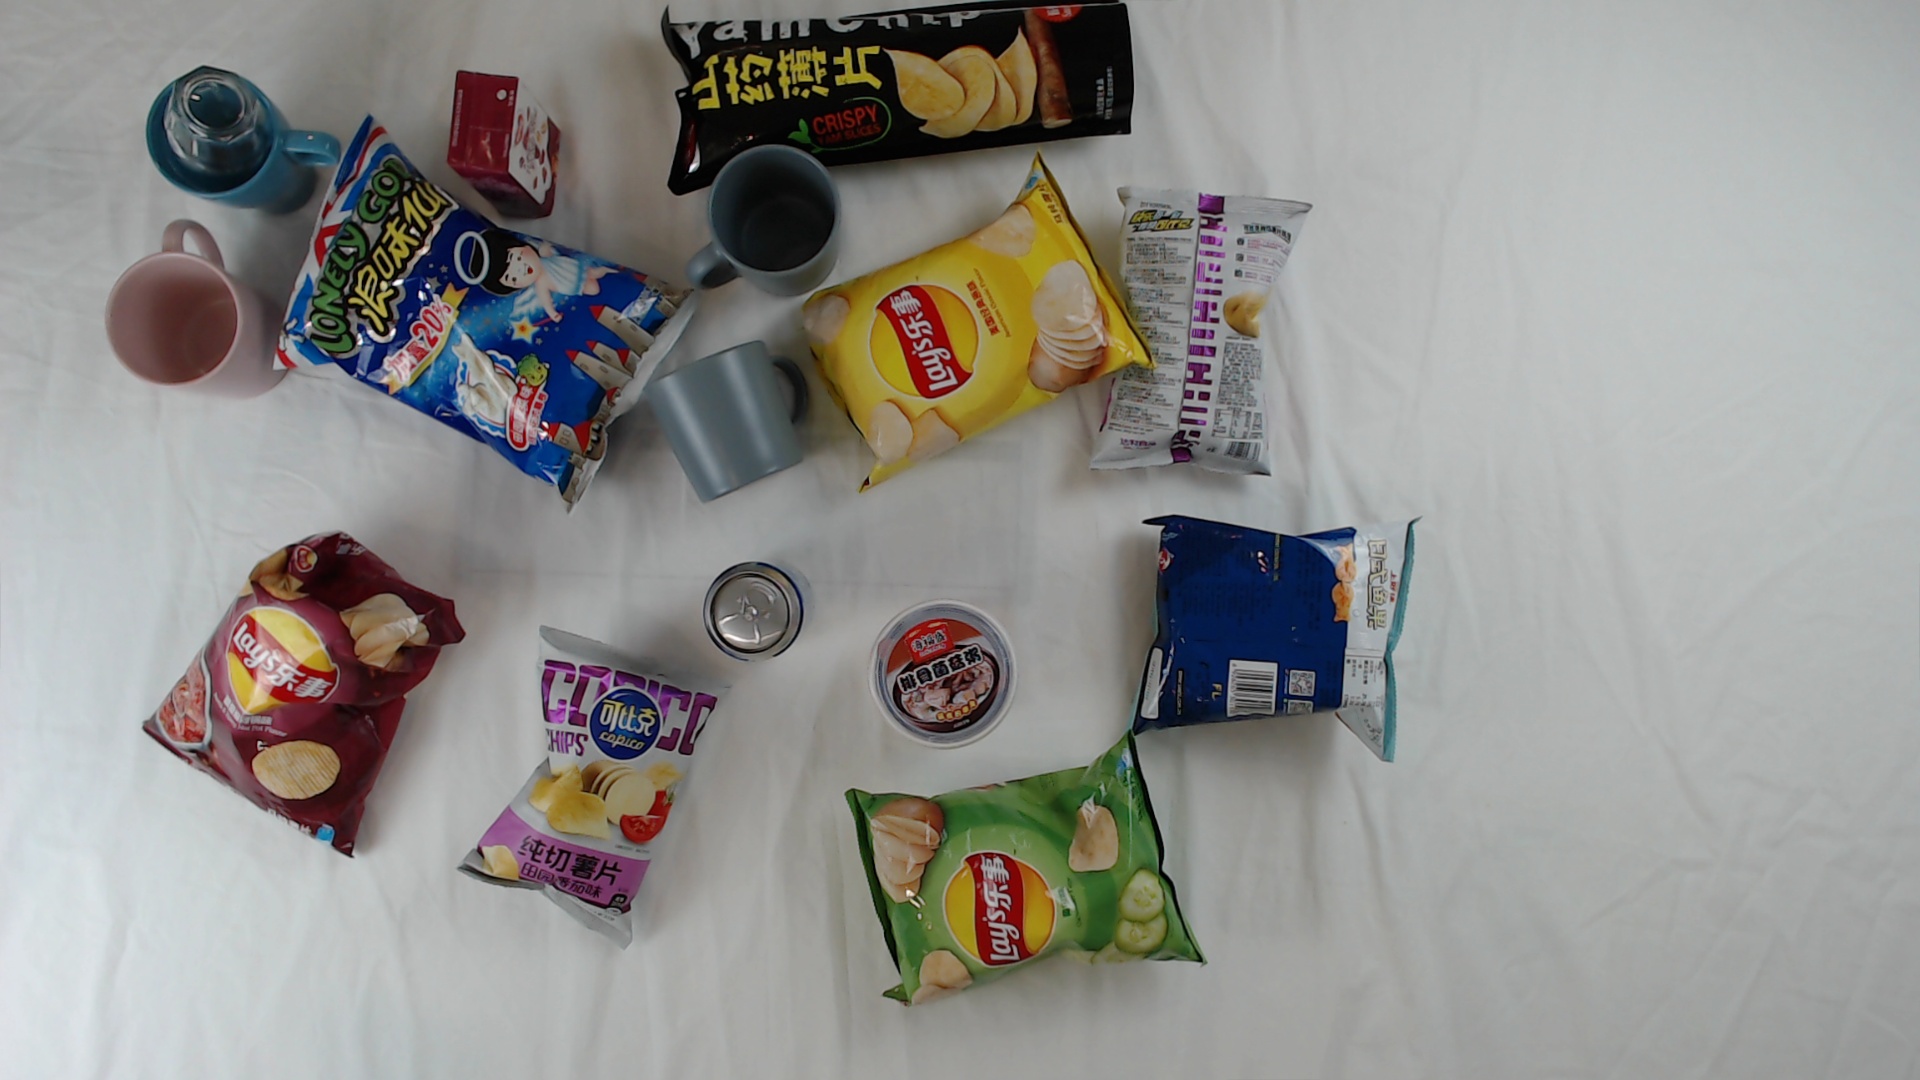
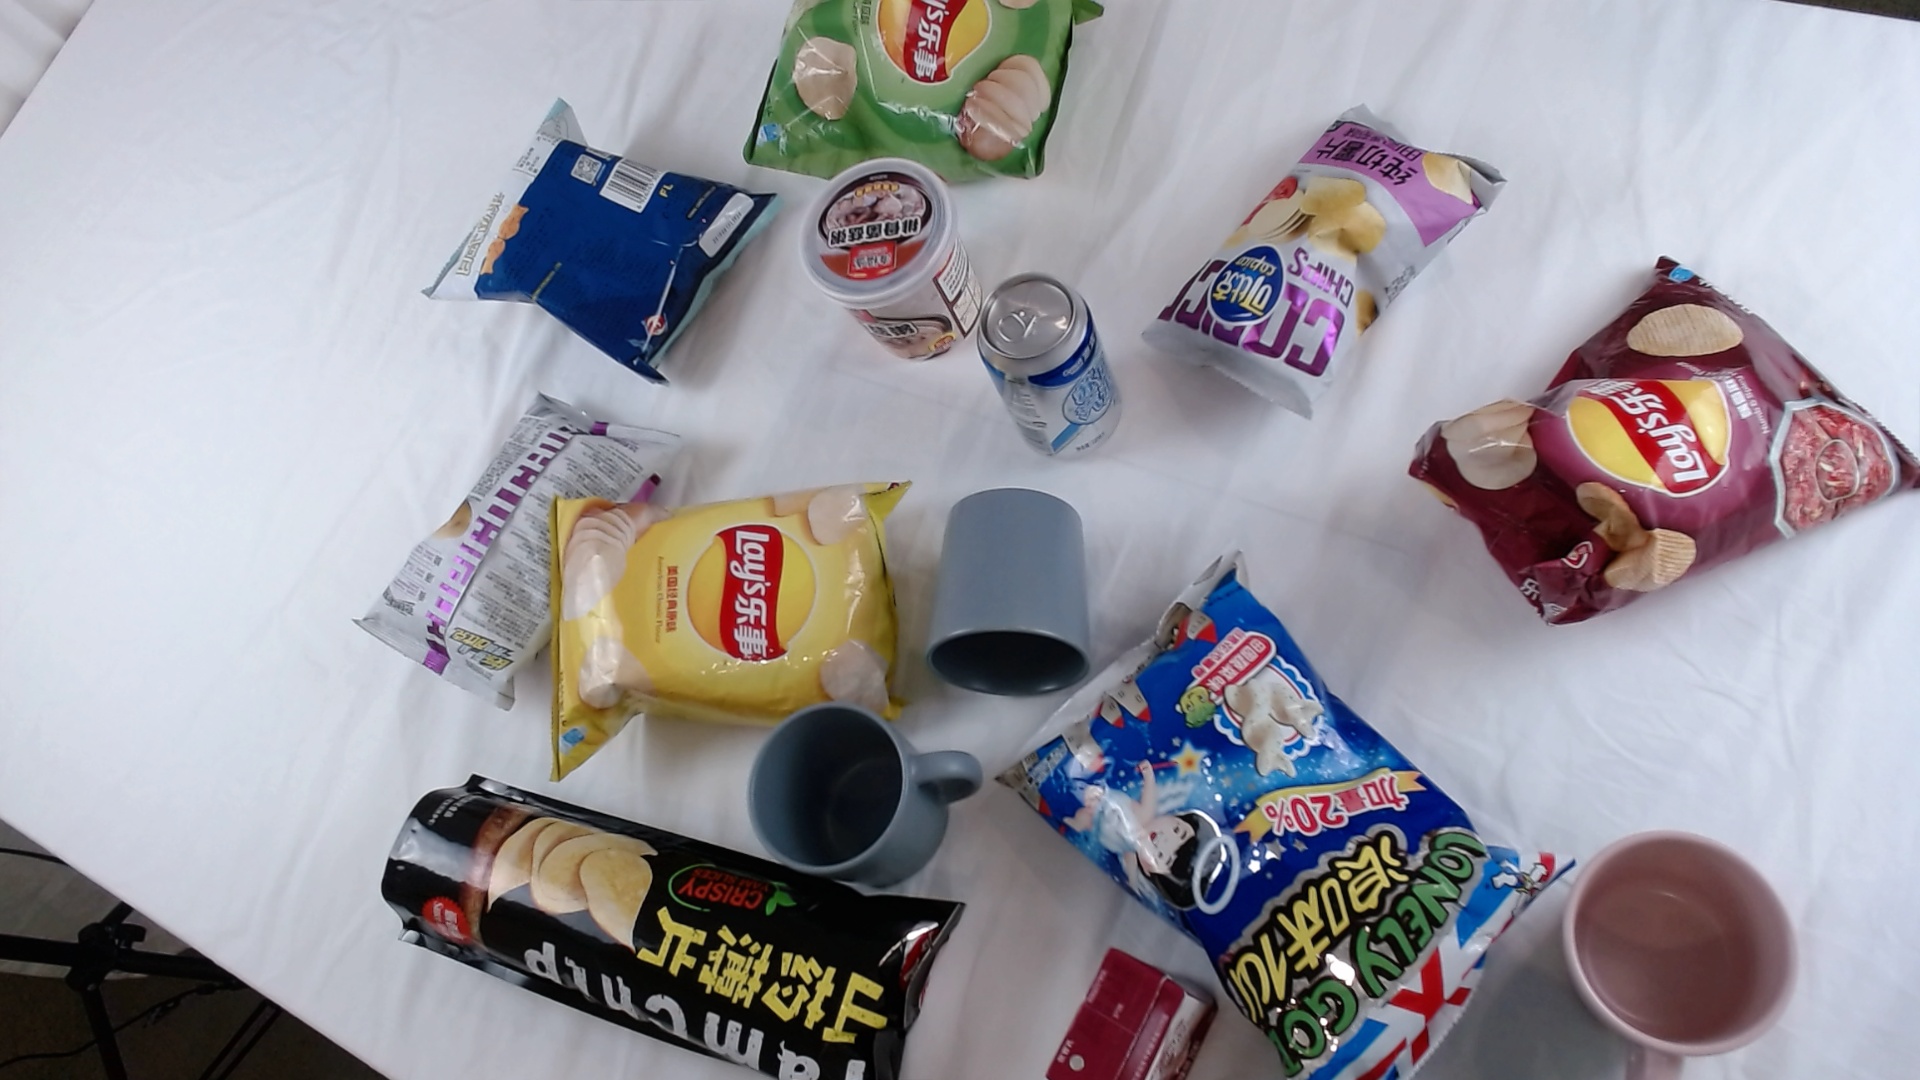
Given several photos, which objects show up again? We start with MessyTable, a labeled collection of everyday objects seen by multiple cameras, and compare existing matching methods with our own combinations.
Identity has to survive a change of view
A mug can look upright from one camera and tilted from another. Its handle may disappear behind another object. Two mugs can also share the same color and shape. The task is to preserve the physical identity across those views and allow an item to remain unmatched when its counterpart is not visible.
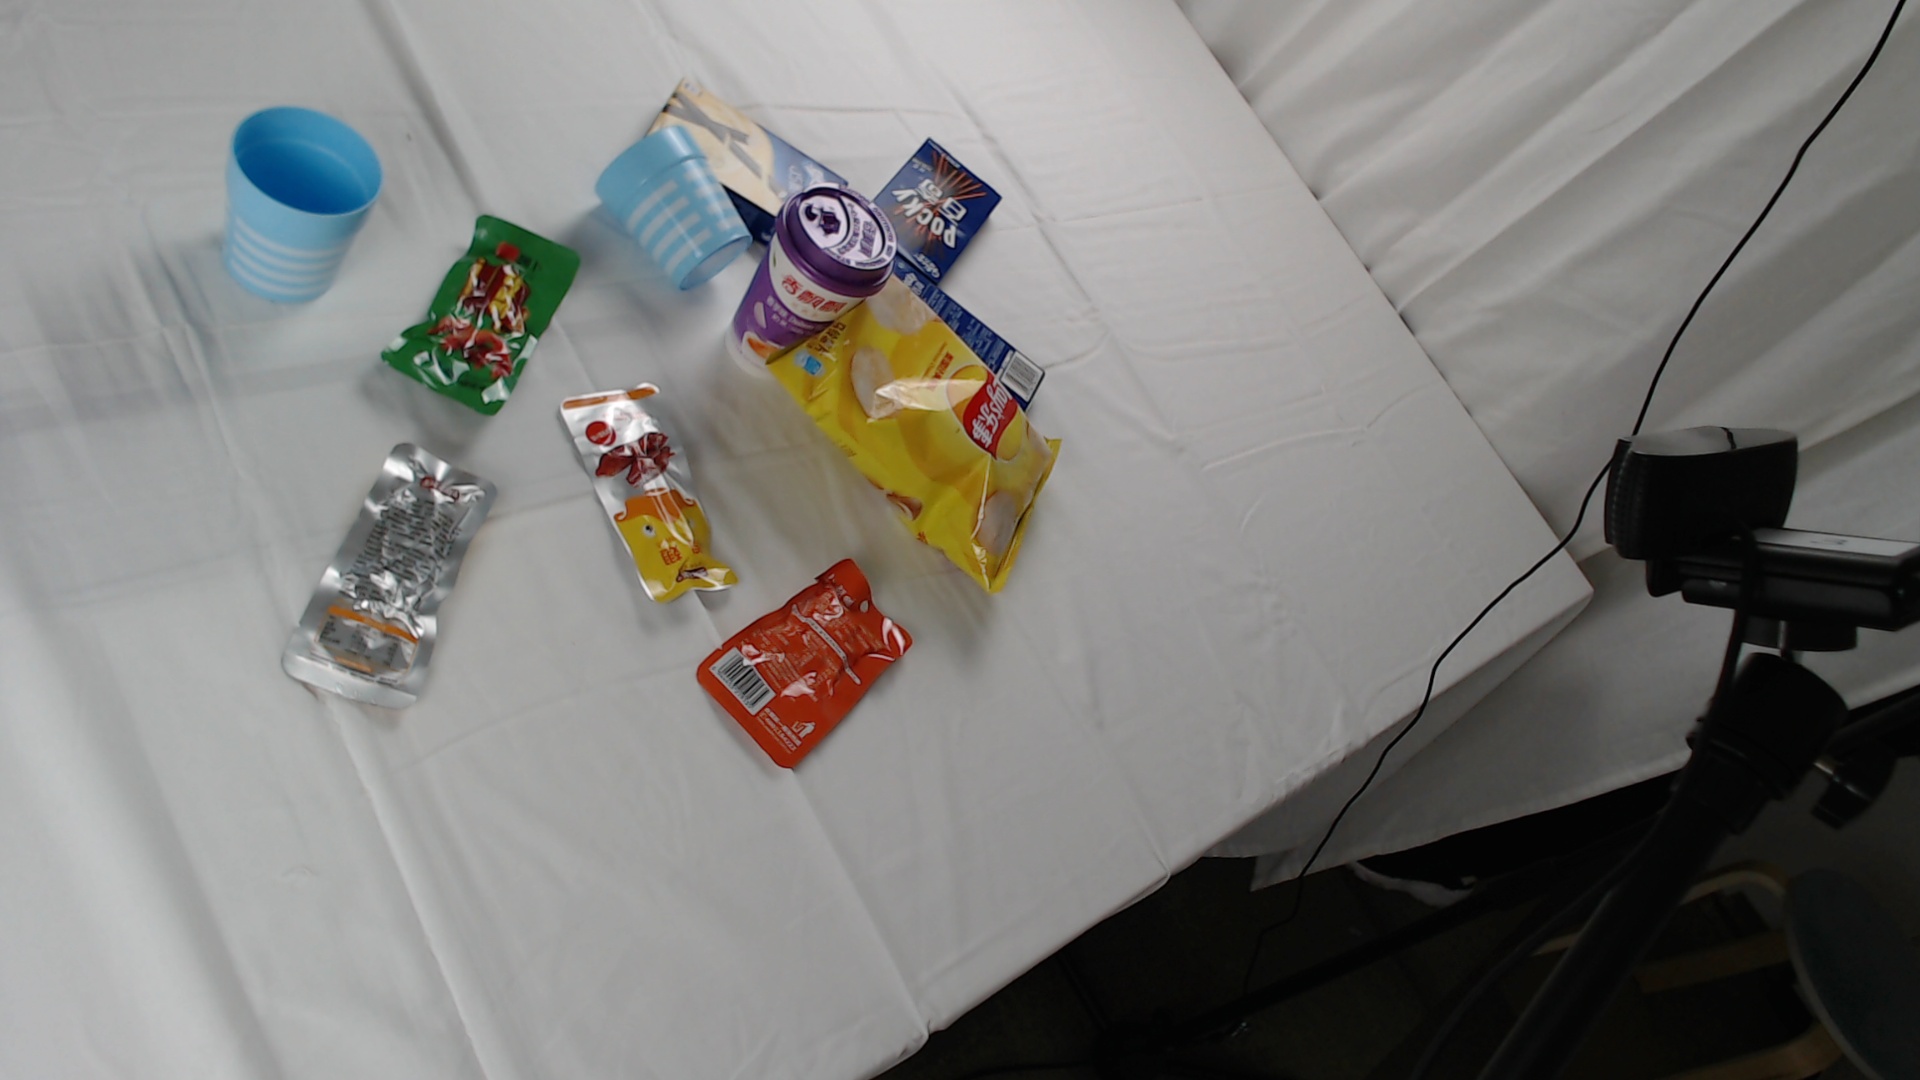
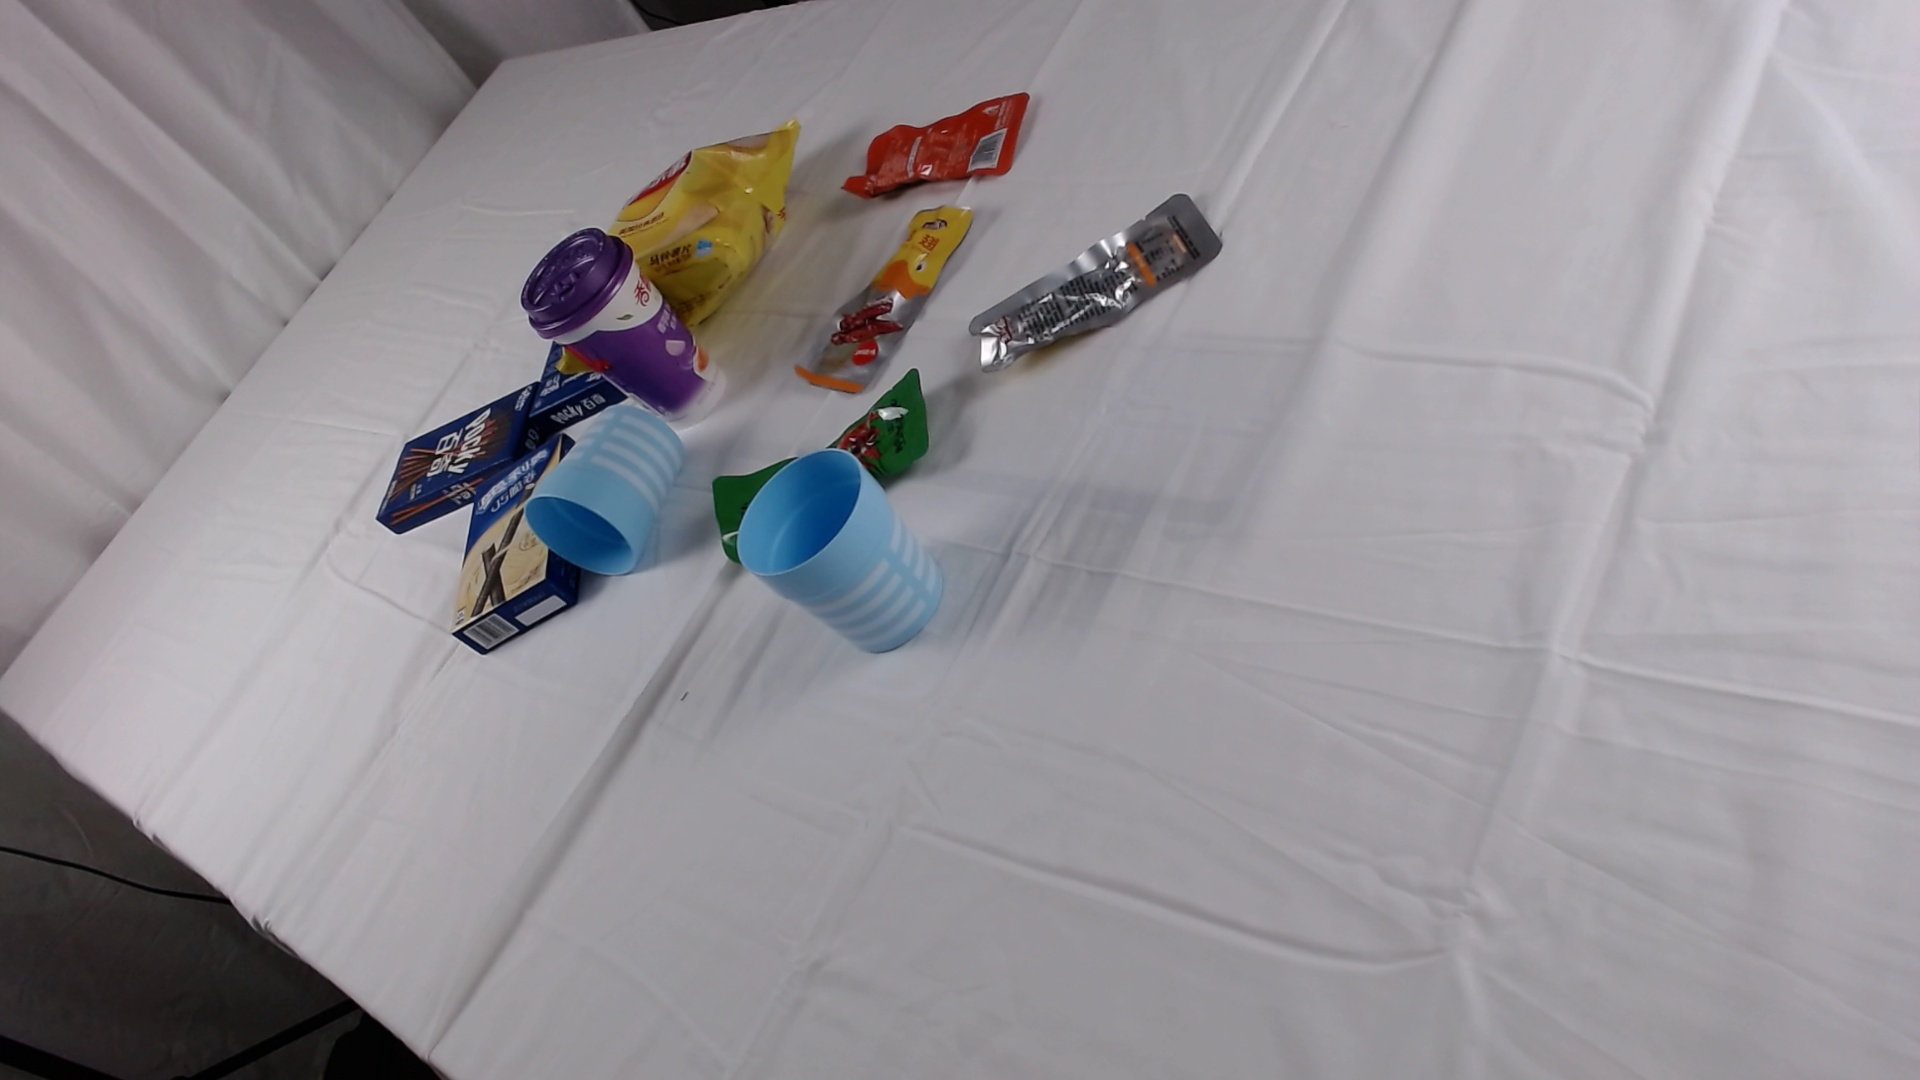
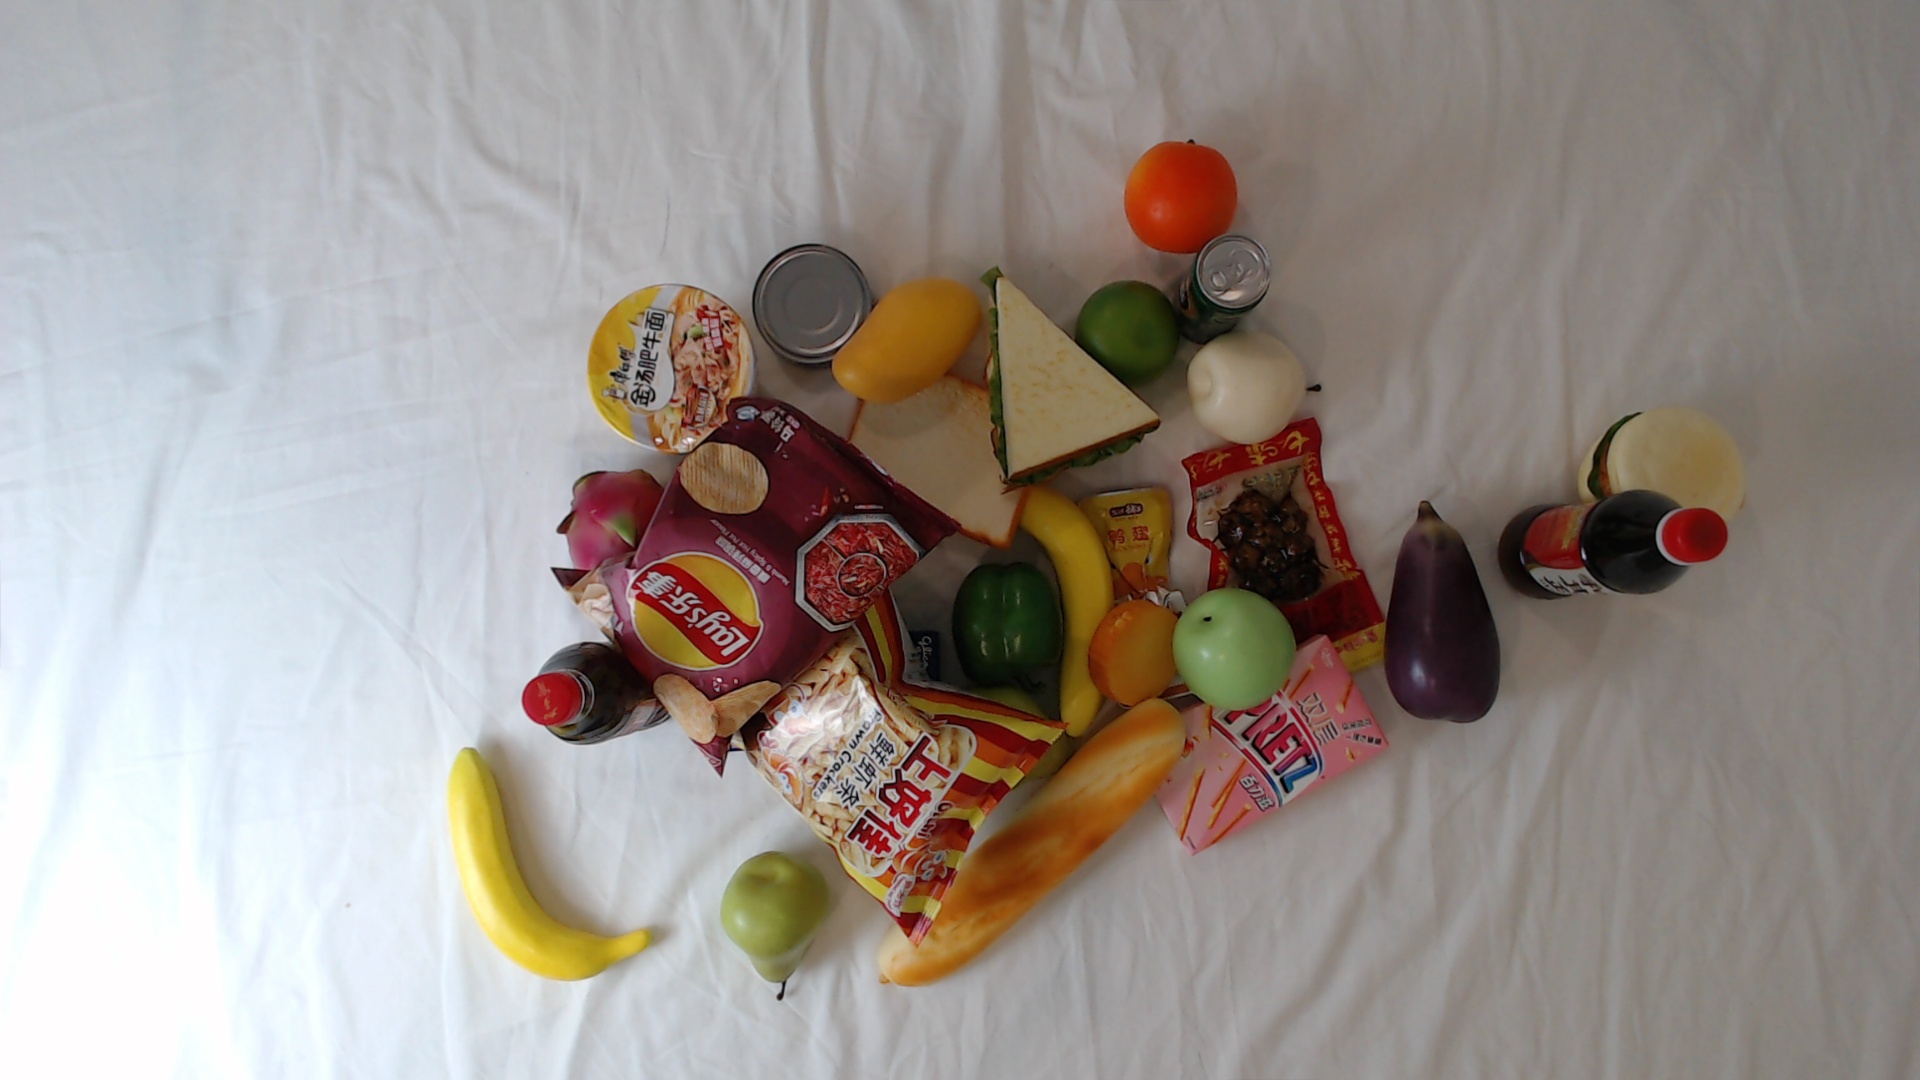
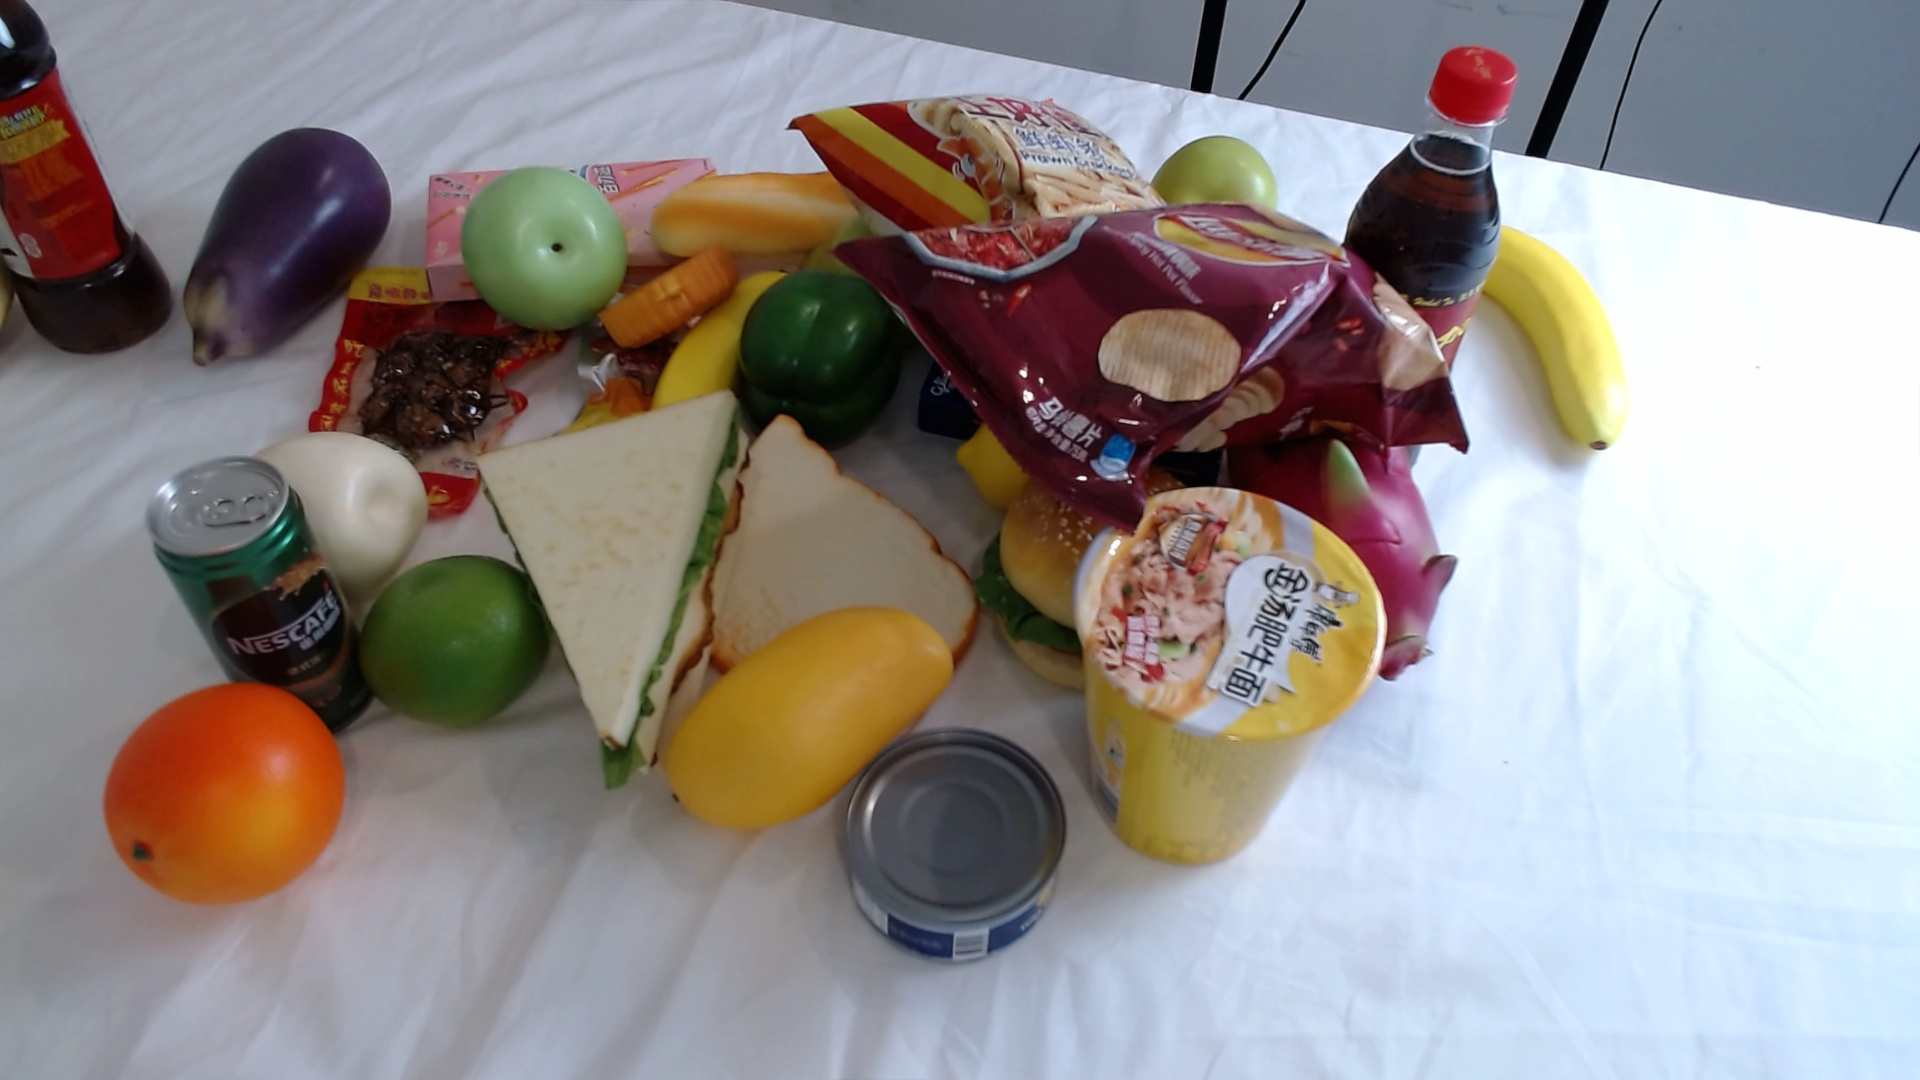
These are full-scene photos from our fixed benchmark. Colored rectangles and numbers show the publisher’s human identity annotations. The examples explain the task and were chosen after scoring. Click a photo to open the original at full resolution.
Two similar mugs, two identities
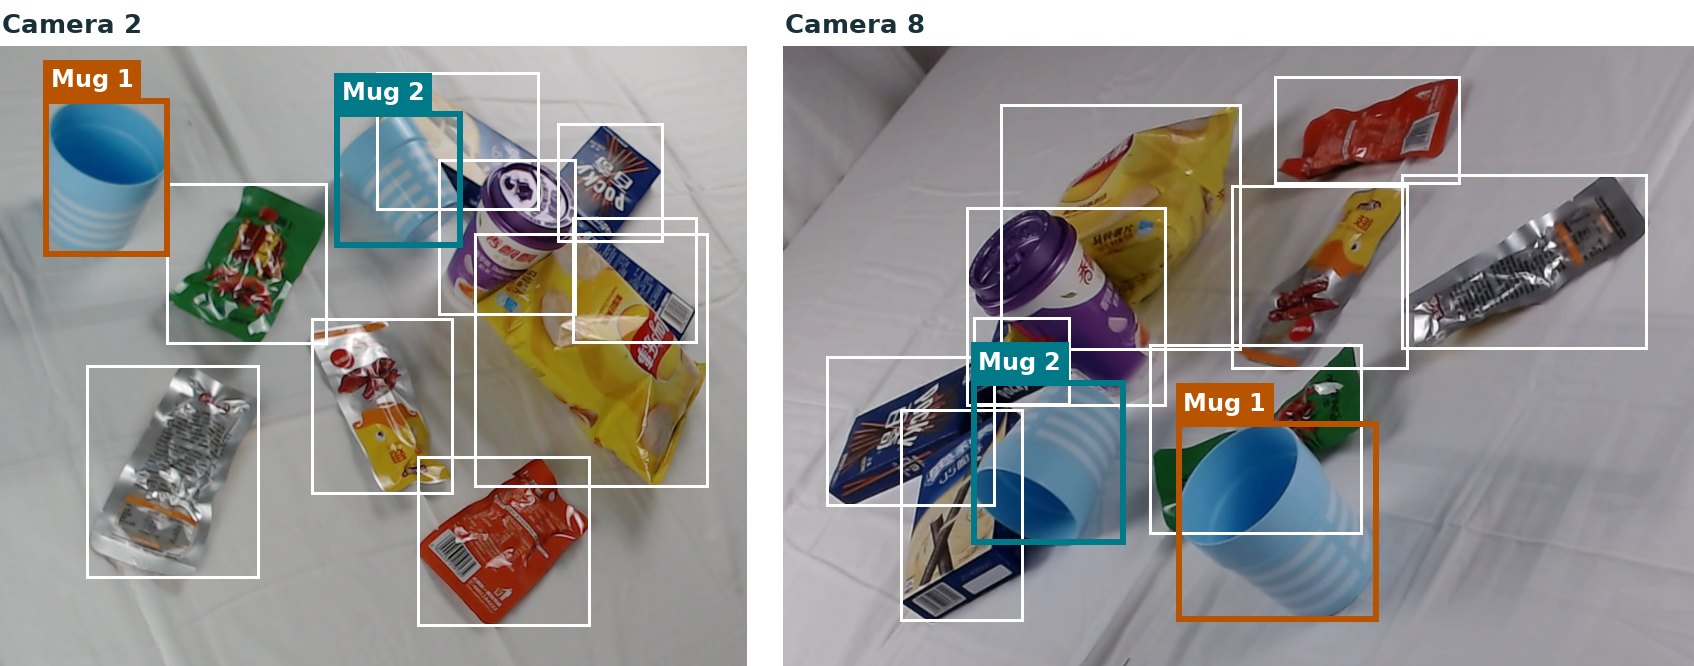
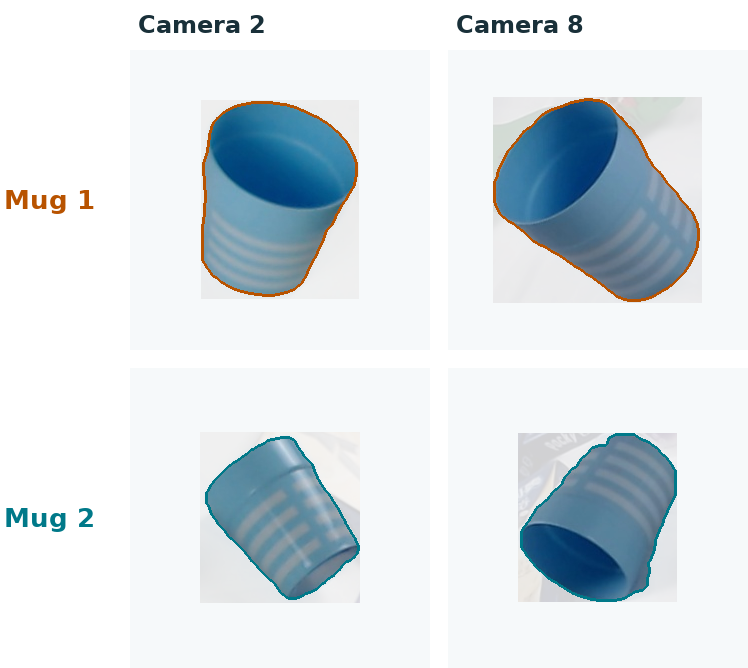
Which blue mug in the left photo is the same physical mug in the right photo?
The orange rectangle marks mug 1 in both views. The cyan rectangle marks mug 2. Their openings, handles and visible surfaces change with the camera angle.
Viewpoint and occlusion change the evidence
Can we preserve identity when only part of an object is visible?
Banana 24 lies beside the green pepper in the overhead view. From the second camera, other items cover much of it. Banana 5 remains a separate physical object across the two views.
Some objects should remain unmatched
Which items have a counterpart, and which have no annotated visible counterpart?
13611Camera 1 · full scene136Camera 7 · full scene
Bag 13Bag 6Bottle 11 · only annotated in camera 1
Bags 13 and 6 appear in both views. Bottle 11 has an annotation in camera 1 and no corresponding annotation in camera 7. The output needs to allow an unmatched item when the evidence does not provide a visible counterpart.
The dataset and the exact population we tested
We kept 100 scenes from 100 camera setups as our common benchmark. A scene is one arrangement of objects photographed by nine cameras. All 36 pairs among those nine views are tested.
What we count
Population
Scene arrangements / camera setups
100 / 100
Full-scene photos
900
Camera-view pairs
3,600
Human-annotated object appearances
21,706
Possible object pairs to score
2,484,124
True same-object pairs
78,335
Easy / medium / hard scenes
30 / 50 / 20
Human boxes define the objects in Part One. Every method gets the same object locations, the same view pairs and the same identity labels for evaluation. This lets us measure the matching stage directly. This fixed 100-scene sample is the population behind every new comparison below.
The photos come from the official MessyTable test split. Selection used a fixed hash rule, and each selected scene has a different camera setup. The scenes show the same object arrangement from different cameras. This is our proxy for cross-view identity matching.
A “true same-object pair” is one physical item visible in two camera views. The same item can contribute to several camera-view comparisons. The count of 78,335 therefore counts view-to-view identity links.
ASNet is the original appearance-and-surroundings reference for MessyTable. It compares an object’s appearance together with neighboring context. ViT-P3DE Tiny is our stronger released reference checkpoint. It combines transformer image features with learned camera-ID and object-position information.
The papers report results on the complete official test set. We first ran the released checkpoints on our fixed sample using the authors’ metrics and original matching solver.
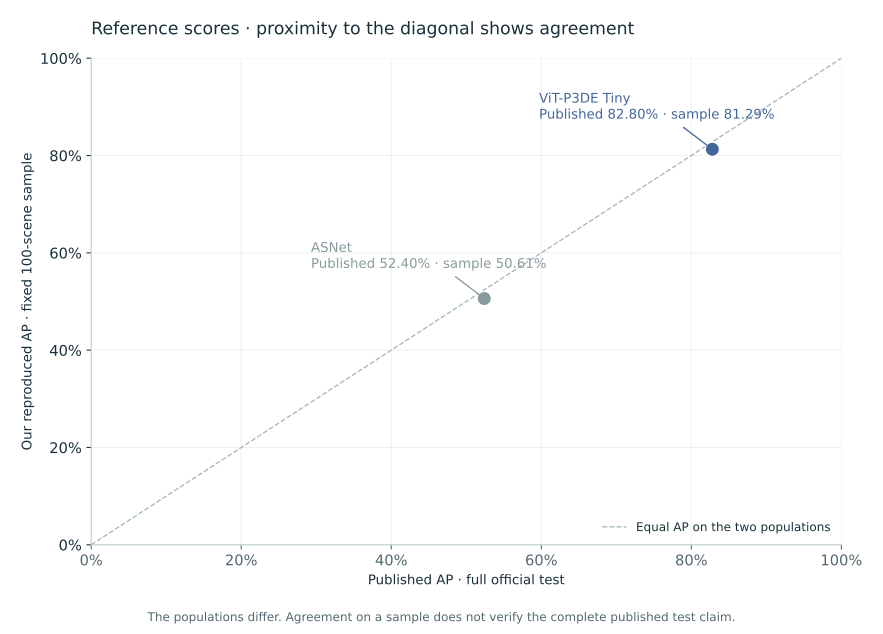
Each point is one released reference. The diagonal marks agreement between published full-test AP and our sampled run. The populations differ. Click any chart to open its scalable SVG.
Swipe horizontally to read the chart at full size.
Reference
Published full-test AP
AP on our fixed sample
ASNet
52.40%
50.61%
ViT-P3DE Tiny
82.80%
81.29%
The matching target for our variations is ViT’s 81.29% AP on this same sample. The sample runs are close to the published figures. Exact reproduction of the full-test claims remains pending.
AP measures how consistently true matches rank above wrong candidates across score thresholds.
FPR95 · lower is better
The fraction of wrong candidate pairs accepted at a threshold that retains 95% of true pairs. A large cutoff tie is marked n/a when the author’s row ordering cannot define a meaningful threshold result.
Fully correct view pairs · higher is better
IPAA100 is the fraction of view pairs with every identity association and unmatched-object decision correct.
What exactly is the new solution?
In one sentence: two independent “witnesses” each judge whether two boxes show the same object, their votes are combined, and every object is then given at most one partner. Here is that process, followed step by step through one real example from the benchmark.
1Two photos
2Two witnesses
3Weigh the votes
4Pair up
5Check the answers
1
Start with two photos of the same table
Nine cameras photograph the same table. We take two of those photos. A person has drawn a box around every object. The boxes say where things are, not which is which. The computer’s job is to work out which box on the left shows the same physical object as which box on the right.
We follow two nearly identical blue mugs. They are hard to tell apart, which makes them a good test. This is an easy scene where things went well: 33 of its 36 photo pairs came out fully correct. Across the whole benchmark the figure is 53%, and in the hardest scenes only 16%.
2
Ask two independent witnesses
Each witness looks at every possible pairing and says how convinced it is that the two boxes show the same object.
The pixel witness
First it lines up the two whole photos point by point, working out where each spot in one photo appears in the other. It keeps only points that survive a there-and-back check. Then it cuts each object out of its background and counts how many matched points land on that object in both photos.
603 matched points from Mug 1 land on Mug 1 (505 going the other way)
0 land on Mug 2
Those points cover only about 8% of the mug, yet that is already strong evidence, because most pairs have none.
Technical names: SAM cuts out the object. RoMa finds matching pixels.
The look-alike judge
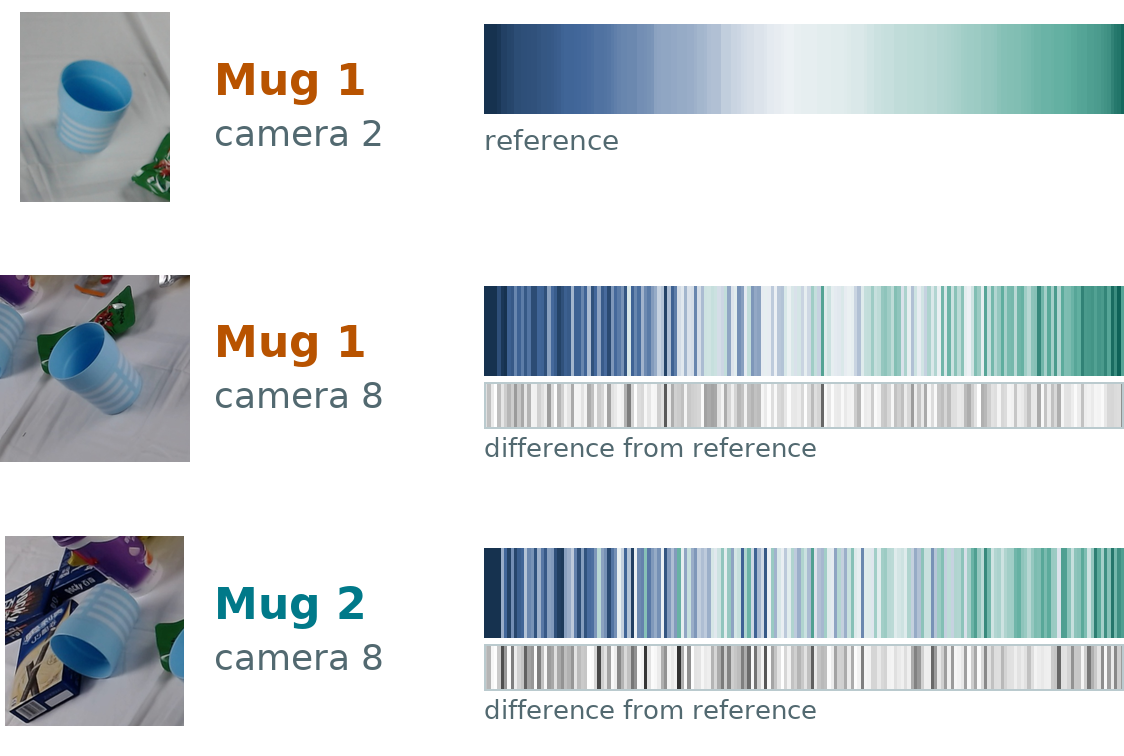
It looks at the object plus a generous border around it, and notes which camera took the photo and where in the frame the object sits. It sums up what it sees as a fingerprint of 192 numbers, drawn below as coloured stripes. The top row is the reference, sorted to fade from blue to green, and the other rows use the same order. The grey strip under each row shows where it differs from the reference: the darker the strip, the bigger the difference.
Mug 1 vs Mug 1: total difference 4.3, closer than 98% of all pairs
Mug 1 vs Mug 2: total difference 6.4, still closer than 83%. The twins fool it a little.
Technical name: ViT-P3DE, a pretrained vision transformer.
3
Weigh the votes
The witnesses speak in different units, so each opinion becomes a ranking: how does this pair compare with all 2,484,124 possible pairs in the benchmark? A score of 97 means “more convincing than about 97 out of 100 pairs”. Pairs that tie share the middle of their tied group. The pixel witness then counts three times, and the look-alike judge once.
Mug 1 ↔ Mug 1 · the right pair
Pixel witness · counts ×397.4
Look-alike judge · counts ×198.3
Combined verdict97.6
Mug 1 ↔ Mug 2 · the wrong pair
Pixel witness · counts ×3no matched points47.5
Look-alike judge · counts ×183.4
Combined verdict56.4
About 95% of all possible pairs have no matched points, or too few to count. They all tie, so each sits in the middle of that group, which is why the wrong pair still gets a pixel score near 50. The combined verdict is worked out from the unrounded scores.
4
Pair up, one partner each
Now the computer chooses the set of pairings with the strongest combined verdicts. Two rules apply. A pairing scoring below about 56 is refused outright, so an object hidden in the other photo can stay unmatched. Each object can have at most one partner.
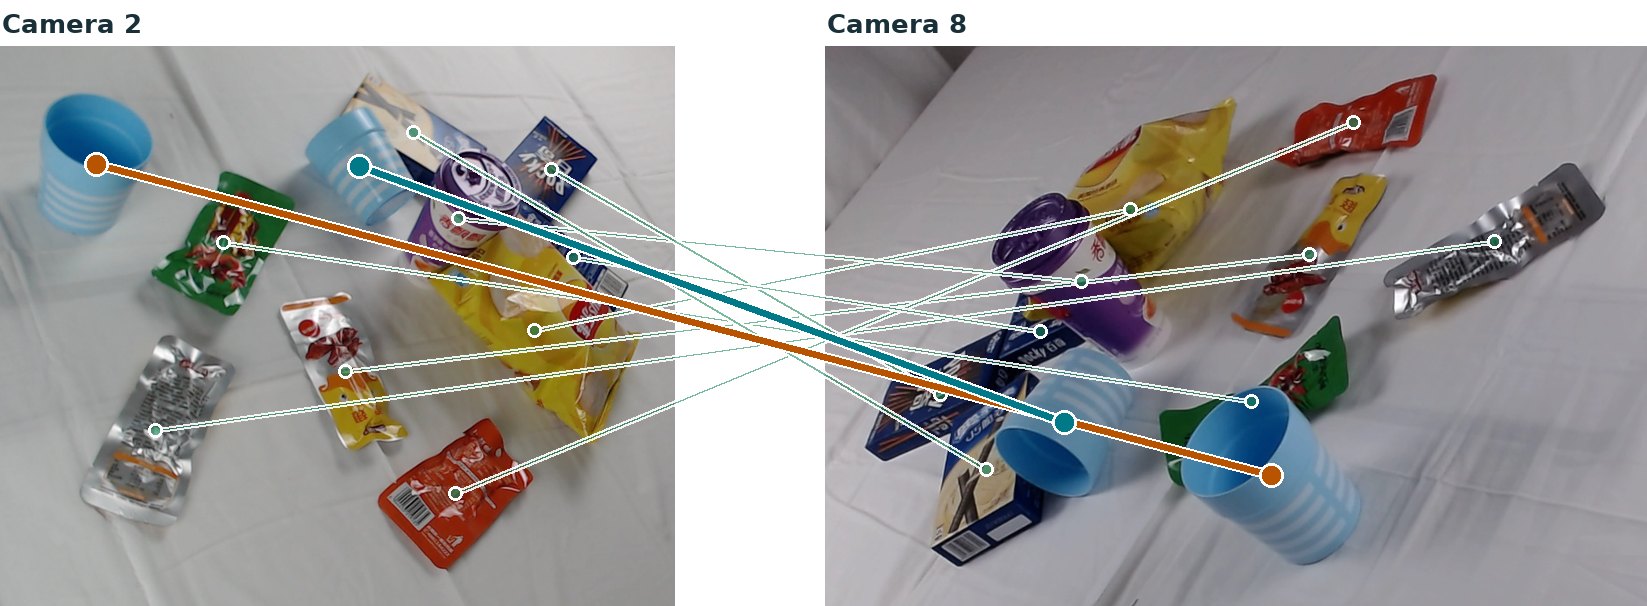
The wrong mug pair scored 56.4, just above the bar, so it could have been chosen. It lost because Mug 1 already had a much stronger partner (97.6). In this photo pair 24 pairings cleared the bar, and the one-partner rule picked 11 of them.
Green line: correct pairing. Red line: a mistake (none here). Orange and teal: the two mugs.
Here, all 11 of 11 objects were paired with the right partner. The pairing was done by the original authors’ own pairing program, fed with our combined scores.
5
Only now, check the answer key
Within each run, the human identity labels are used only at the very end. Repeating these steps on every pair of photos in the benchmark gives:
74,159of 78,335 true links found (94.67%)
6,147wrong links, out of 80,306 proposed
90.6ranking quality out of 100: how well true pairs rise above false ones, before pairing up. The look-alike judge alone scores 81.3. (Technical name: average precision.)
A caution: we chose this setup after comparing 45 options on these same photos, so these numbers may be a little optimistic for new photos.
Example: scene 20190921-00003-02, cameras 2 and 8, chosen after scoring to explain the method. Pictures and numbers come from the saved results; no model was rerun.
The same steps in technical terms
Two full-scene views + the human boxes + camera information
Foreground correspondence branch
SAM takes each human box as a prompt and estimates the visible object pixels inside it.
RoMa v2 computes pixel correspondences across the two full scenes, in both directions.
For each proposed object pair, we measure how much confident correspondence falls inside its foreground masks. A round-trip check and minimum pixel support define the score.
This branch answers how well the visible object regions correspond across the views.
Appearance and position branch
ViT-P3DE Tiny receives a crop expanded to twice the human box’s width and height, together with the camera ID and box position.
The pretrained model produces a feature vector for each object appearance.
The distance between two feature vectors supplies the appearance match score.
This branch supplies another source of evidence when the views reveal different object surfaces.
↓
75% RoMa + SAM rank + 25% ViT rank
↓
One-to-one assignment within each view pair, with unmatched items allowed
The percentages blend the two scores after converting them to percentile ranks over the common candidate population. The pretrained model weights stay frozen.
This was the strongest of 45 configurations we tested, including the two reference controls. The sweep covered crop size and context, DINOv2, foreground masks, grayscale and edges, rotation, calibrated geometry, perspective correction, dense correspondence and fixed score blends, including a 50/50 blend and blends with ASNet and DINOv2.
How the tested directions changed the scores
Change
Control AP
Modified AP
Perspective correction used foreground keypoints, a homography fitted to part of the evidence and a check on held-out correspondences. The unwarped control uses the same visible surface patch. Its AP was 41.24%, compared with 41.17% after rectification.
The mask, geometry and crop settings were fixed for the sweep. The two fusion weights came from previously explored settings and received no fitting on the new labels.
Results on the same 100-scene benchmark
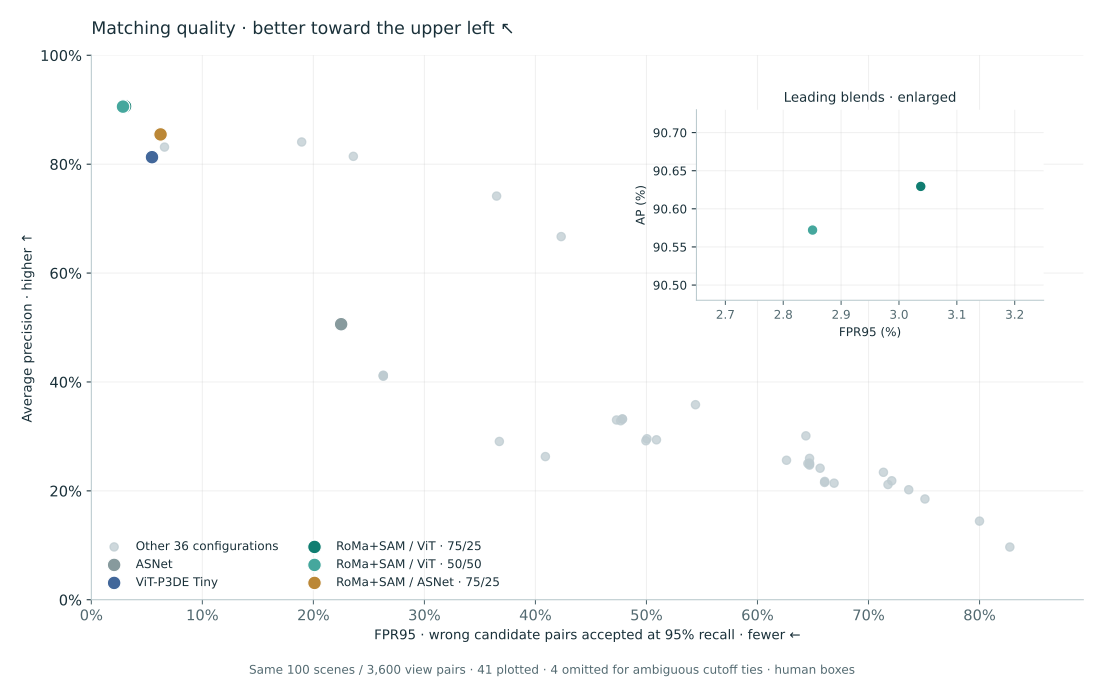
The best blend reached 90.63% AP, compared with 81.29% for ViT alone. It also reduced FPR95 and increased the fraction of fully correct view pairs.
Read the map. Each point is one configuration. Move left to accept fewer wrong candidates at 95% recall, and up for better average precision. The upper left is better. Colors mark the references and three leading blends; gray points show the other 36 plotted variations. The inset enlarges the two nearly tied leaders. Fully correct view-pair accuracy remains in the table.
Four RoMa-only FPR95 values are n/a because of tied scores. For roma_box, roma_mask, roma_box_mean and roma_mask_mean, the 95%-recall cutoff falls inside a group of more than two million zero-coverage scores. The author code splits this group by array sort order, which does not correspond to a score threshold. These four configurations stay in the 45-row table, with FPR95 marked “n/a — tied scores”, and are omitted from this AP/FPR95 chart. Their AP and actual assignment results remain available.
Why reproducing the author’s FPR95 value was not sufficient
The exact pinned author code reproduces the original 17.37%, 46.44%, 18.29% and 46.37% scalars. They are preserved in the audit. The code sorts individual rows and stops partway through the equal-score block, so a different tie ordering can change the answer without changing the scores.
For roma_mask, the 2,357,583-way zero-score block makes the row-based number range from 2.27% to 100%. A real score threshold cannot select an arbitrary part of that block. Before accepting it, recall is 91.73% and FPR is 2.27%; accepting it gives 100% recall and 100% FPR. The 2.27% endpoint is not an operating point at 95% recall.
All 45 configurations were audited. ASNet and two DINO variants have two-candidate ties, each affecting one negative out of 2,405,789. Their values are unchanged at the displayed two decimal places and are annotated in the audit. The four large RoMa ties are the only ones whose displayed FPR95 depends on tie ordering.
The headline blends have no cutoff ties. The leading 75/25 blend retains 3.04% FPR95. All 45 AP values are distinct, so guarding FPR95 as a secondary ranking key leaves the original order and top three unchanged. AP uses the author’s average_precision_score calculation, which handles tied score groups.
The top three configurations are selected by AP, then usable lower FPR95 and higher IPAA100. All AP values are distinct, so the guarded FPR95 tie-break does not change the ranking. The two RoMa+SAM/ViT blends are close in AP. The 50/50 blend has the lower FPR95, while the 75/25 blend has the higher whole-pair association accuracy.
How many actual identity links did we recover?
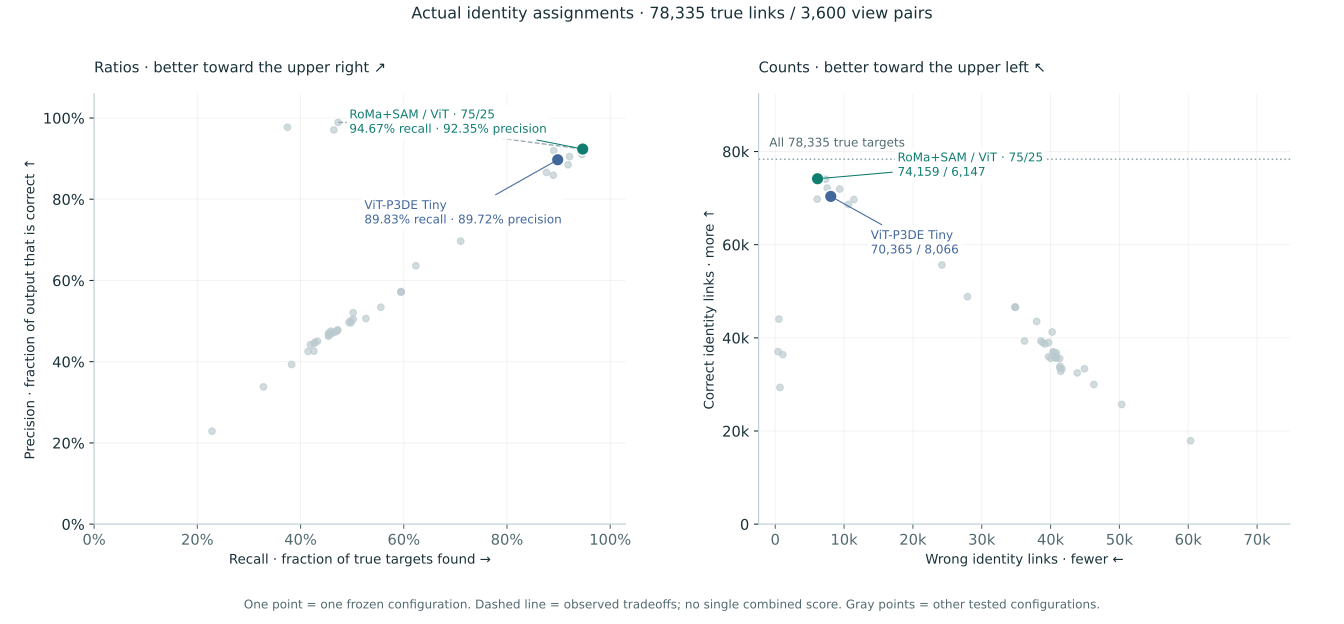
There are 78,335 true object pairs in this benchmark. Under the authors’ assignment rule, the best blend recovered 74,159 of them, giving 94.67% link recall. It also proposed 6,147 wrong links.
The left plot shows identity-link recall versus precision. Its upper right is better. The right plot shows wrong links versus correct links, with the full target marked by a dotted line. Its upper left is better. The dashed line joins the best observed recall/precision tradeoffs; it does not represent a new model or a threshold sweep.
All 45 configurations remain on these assignment charts, including the four RoMa scorers: their actual assignment counts do not use the ambiguous FPR95 cutoff. These ratios describe Step 2 identity links on 100 scenes. Part Two uses the same layout for Step 1 detection on a different population.
Matcher
Correct links
Wrong links
True links recovered
All proposals
These counts use the original solver, 95th-percentile distance normalization and fixed 0.70 assignment cutoff. Each scorer has a fixed distance transform, and its final proposal count follows that rule. Every endpoint is a supplied human annotation.
Inspect all 45 configurations
Four FPR95 cells are “n/a — tied scores”. Sorting by FPR95 places these rows last. AP, whole-pair accuracy and actual identity-link counts remain unchanged. See the cutoff audit above for the retained original scalars.
Method
AP ↑
FPR95 ↓
IPAA100 ↑
Correct links
Wrong links
Part One shows that combining foreground correspondence with the pretrained ViT matcher improves our fixed-sample results. These winners were selected after comparing the 45 configurations on this sample. Generalization to other scenes, time-separated observations and trucks remains to be measured.
Evaluation scope and evidence
The new benchmark has 100 complete scenes and 3,600 camera-view pairs. All variations used the same human boxes and candidate population.
The ASNet and ViT reference scores reproduced the preceding sample runs exactly.
The original author metric code and native Linux matching solver ran in a pinned Python 3.7 environment.
All score arrays were frozen before the sweep’s metric evaluation. Models received no additional training.
New distance transforms received no per-method threshold fitting. Final assignments therefore also reflect score calibration.
The scene examples show human labels and serve as illustrations. They are not a gallery selected to claim model success.
The full official test contains 1,861 scenes and 66,996 view pairs. Published full-test figures are context for this sampled study.