Part One
Given human-drawn boxes, how well can the system match objects? This isolates the matching stage.
Visual Re-ID study · Part Two · Updated November 12, 2026
We want a system that can look at two photographs and say which objects appear in both. This part asks a simpler question: can it draw a useful box around each object, including the small and partly hidden ones?
Our strongest progress came from teaching YOLO with human-labelled examples, showing it close-up sections of each photo, and preserving more image detail. Feeding its own guesses back into training did not demonstrate the improvement needed to continue that experiment.
Completed experimentsFull test: 16,749 photosNo new experiments in this rewriteImagine a table covered with cups, packets and boxes, photographed from several directions. We want to recognise the same cup across the photographs. First, the system needs to separate that cup from the objects around it. If it overlooks the cup in either photo, the next stage cannot compare it. If one box contains two objects, the comparison starts with an ambiguous picture.
Detection means finding an object and drawing its box. Identity matching means deciding whether a box in one photograph and a box in another show the same physical object. Finding “a cup” does not establish that it is “the same cup”.
MessyTable provides cluttered scenes, several camera views, and human-drawn boxes with object identities. We use those labels as the answer key to measure how well the detector finds individual everyday objects.
Given human-drawn boxes, how well can the system match objects? This isolates the matching stage.
Starting with complete photographs, how well can YOLO find the objects? Can simple preparation and limited training help?
Part Three will feed these boxes into the matcher and measure correct identities.
We use YOLO26m as the detector: a model that predicts object boxes and gives each a confidence score. We improved what it sees, what it has learned, and how its predictions are combined.
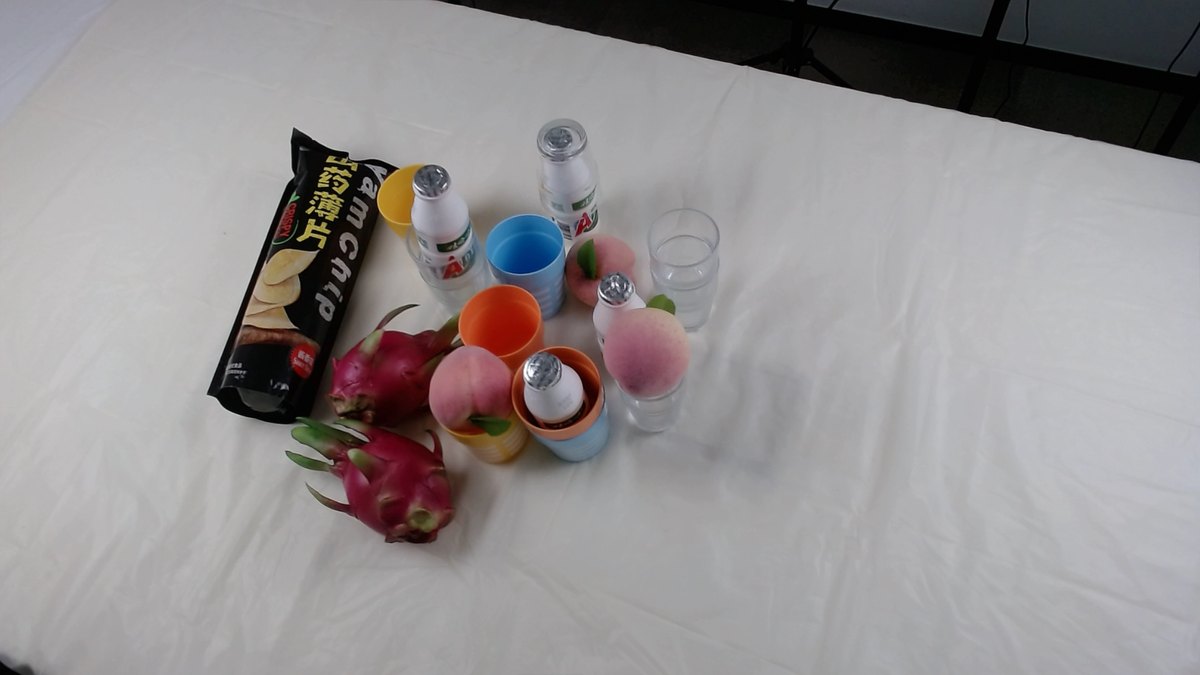 Keep the original colour image and its detail.Example: one camera’s view; people labelled 22 objects (used only to score).
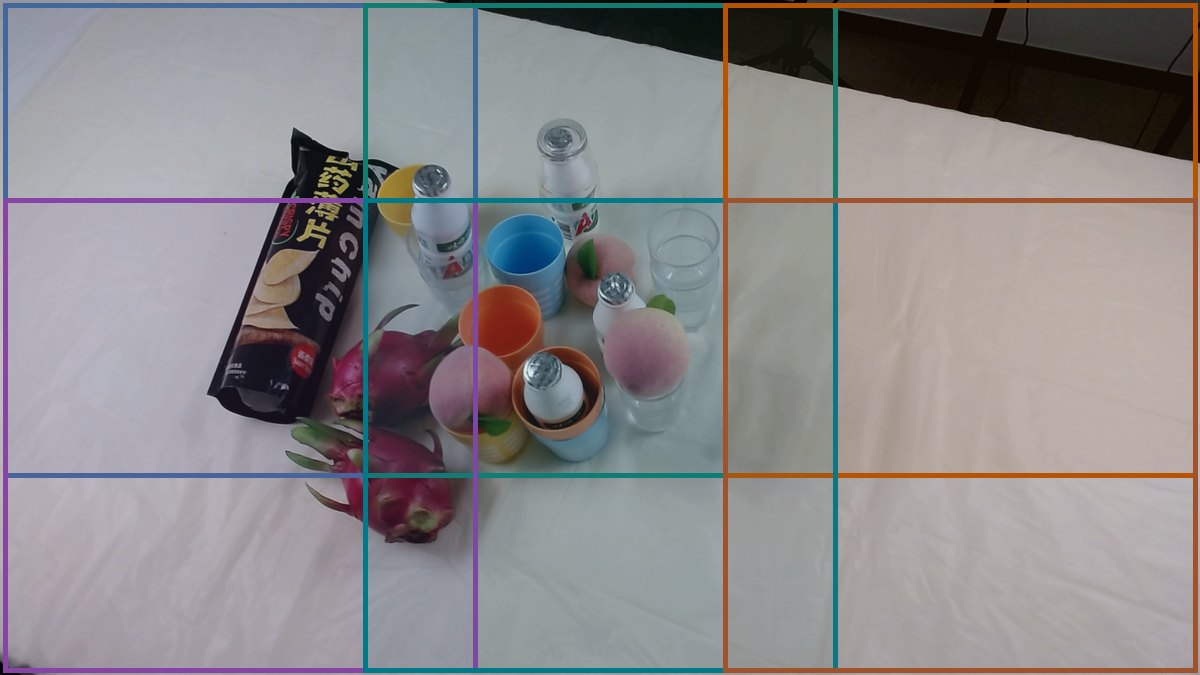 Use the whole photo and six overlapping close-up tiles. Choose a full-frame input size of 768 or 1024 pixels.Example: the whole photo plus these six overlapping 768-pixel tiles.
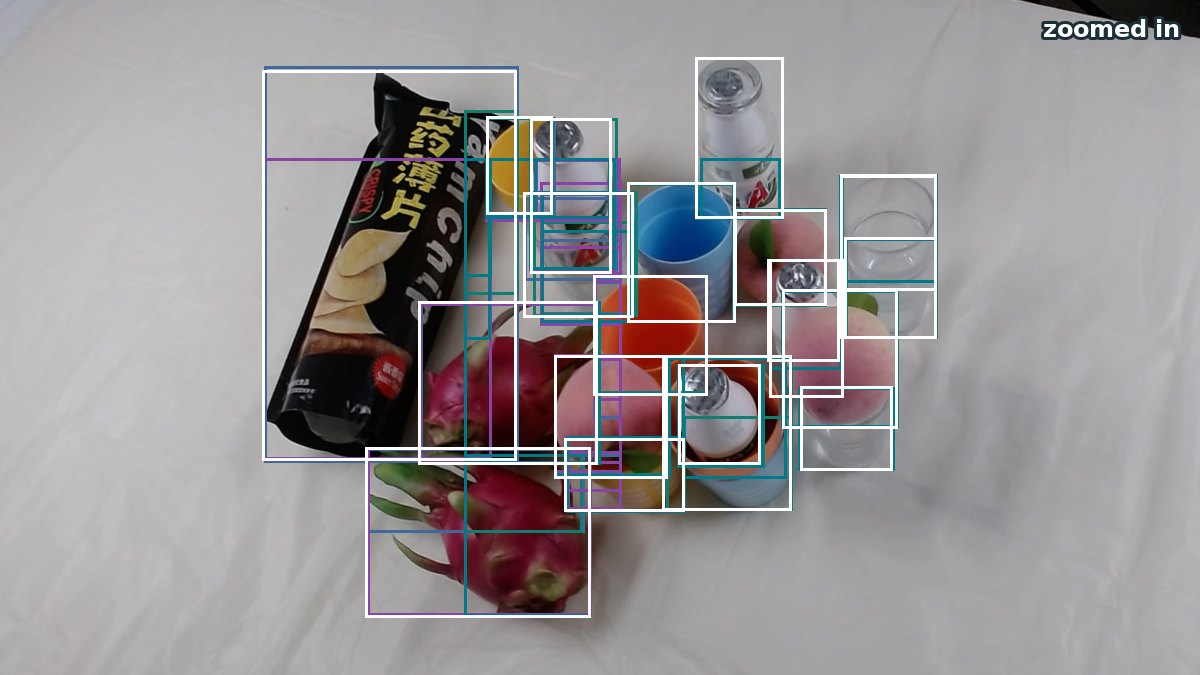 Run the trained YOLO detector on each view. Keep predictions above the fixed confidence cutoff.Example: 92 candidate boxes, 21 whole photo, 71 tiles (one colour per tile). Many are duplicates.
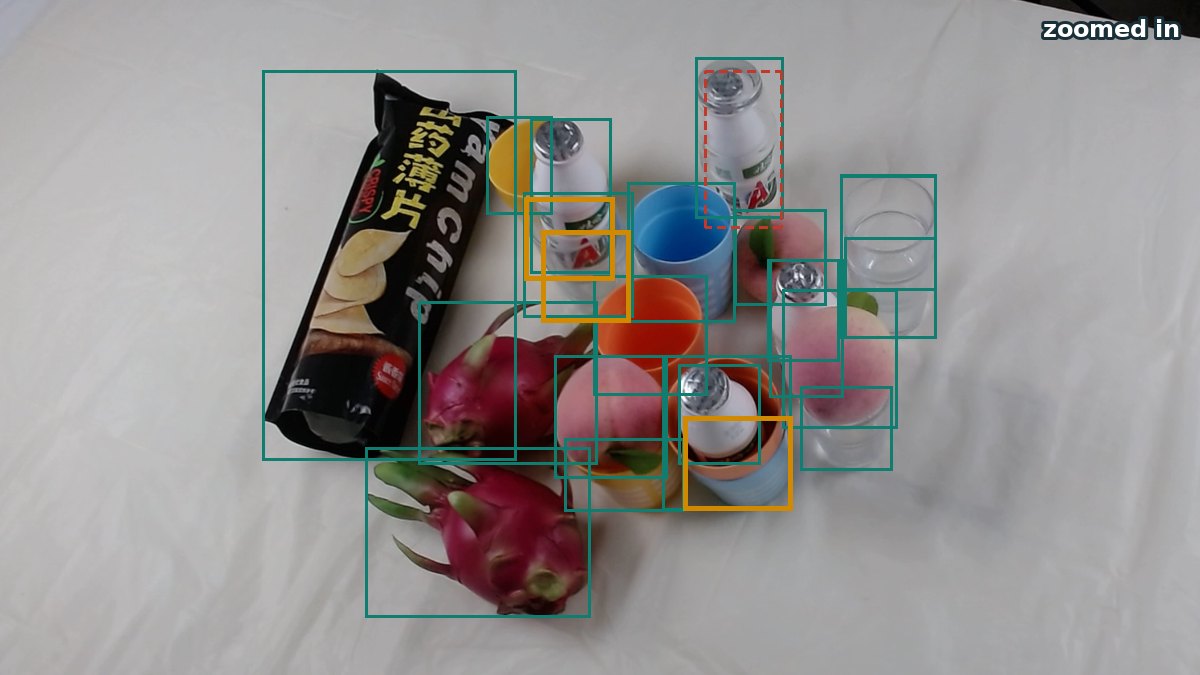 Return tile boxes to original-photo coordinates. Remove overlapping duplicates and fragments at artificial tile boundaries. Output the final detection boxes.Example: 24 boxes, whole photo 3 from tiles; objects found 19 → 21 of 22. Missed: two bottles in line got one box.
Example photo: scene 20191004-00180-03, camera 7, run through detector H (2,400 labelled photos, 1024-pixel full frame plus tiles). Boxes come from its saved predictions, and the rebuilt combine step reproduces the saved final boxes exactly. The Step 1 and Combine photos are zoomed in. The photo was chosen to show where tiles help: among the 900 Part One sample photos where tiles add at least two found objects, it has the most typical amount of clutter. In many easier photos the whole frame already finds everything.
A tile is a close-up cut from the original photo. It gives a small object more space in the detector’s input without inventing detail. Overlap helps avoid losing objects at the cuts. The same object can appear in several tiles, so the combining stage matters.
1024 versus 768 is an input-resolution setting. The whole scene is resized less aggressively at 1024, preserving more detail. In the latest comparison, tile size stays fixed at 768. The tests therefore distinguish larger full-frame inputs from adding tiles.
The useful Step 0 result was mainly about scale. Tiling and higher resolution helped. Earlier work also explored grayscale and local contrast changes, but these are not part of the validated full-test recipe reported here. We have not established that a general “clean up every image” filter improves the system. Colour, printed text and texture can be useful identity evidence.
Training on tiles and predicting on tiles are separate changes. Predicting on tiles reuses an existing model. Training on tiles lets the model learn how objects and clutter look in those close-ups.
If 100 human-labelled objects are present and we find 94, recall is 94%. Missing objects lower recall.
If 100 predicted boxes are emitted and 86 can be assigned to different human-labelled objects, precision is 86%. Extra or poorly placed boxes lower precision.
An object needs a usable box in both photographs. This measures detection in two views; it does not establish the identity.
A usable box must overlap a human reference box sufficiently. The main test uses intersection-over-union, or IoU ≥ 0.50: the shared area must be at least half the total area covered by at least one of the two boxes. Each predicted box and each reference box can count only once.
Unmapped means a prediction cannot be assigned to a distinct labelled object under that rule. It could be a duplicate, a partial object, a box around several objects, background, or scene content outside the dataset’s target list. It does not automatically mean the model imagined an object.
A missed target is different: it is a human-labelled object left without a usable prediction. Unmapped boxes count predictions; missed targets count reference objects. Confusing them can make an apparent improvement look much stronger than it is.
| Question | Evaluation population | What is counted? |
|---|---|---|
| How well does detection work? | Entire official test: 16,749 photos, 1,861 scenes, 188 setups | 408,937 labelled object appearances; 66,996 camera pairs with 1,486,614 true shared-object links |
| Did automatic-label training help? | Earlier Development100 experiment: 100 pairs, 200 photos | 2,173 true shared-object links; a separate calibration set chose cutoffs |
A scene is one table arrangement photographed by several cameras. A setup groups related scenes. A single object can contribute many appearances and many camera-to-camera links; these are not hundreds of thousands of unique physical products.
The full detection test covers 33.36% of all 50,211 downloaded photos, and 100% of the official test split. Training and validation photos are not added to this test to inflate its size. The available labelled training pool contains 16,920 photos; the newest run uses 2,400 of them.
Original100 is a separate historical cohort of 100 pairs. That cohort receives no new scores in this study.
The latest configuration finds 94.01% of labelled appearances, with 85.89% precision. It uses a detector trained on 2,400 labelled photos, predicts full frames at 1024 pixels, and adds overlapping tile detections. Shared objects have usable boxes in both views 90.12% of the time.
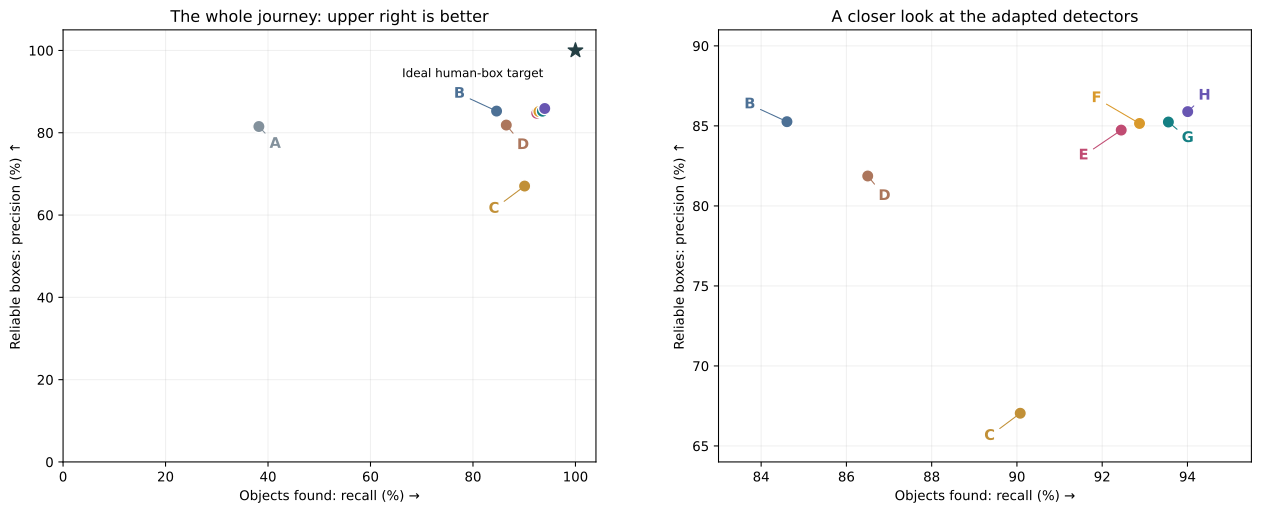
| Configuration | Found / 408,937 | Recall | Precision | Unmapped boxes | Boxed in both views |
|---|---|---|---|---|---|
| A · Released YOLO, no local training | 156,280 | 38.22% | 81.51% | 35,440 | 26.83% |
| B · 150 labelled photos · full frame, 768px | 345,982 | 84.61% | 85.26% | 59,805 | 76.31% |
| C · Same 150-photo model + raw tiles | 368,359 | 90.08% | 67.04% | 181,070 | 84.04% |
| D · Same 150-photo model + filtered tiles | 353,732 | 86.50% | 81.87% | 78,344 | 78.99% |
| E · 600 labelled photos + tiles · 768px | 378,047 | 92.45% | 84.74% | 68,094 | 87.73% |
| F · Same 600-photo model + tiles · 1024px | 379,803 | 92.88% | 85.15% | 66,231 | 88.39% |
| G · 2,400 labelled photos + tiles · 768px | 382,572 | 93.55% | 85.24% | 66,238 | 89.39% |
| H · Same 2,400-photo model + tiles · 1024px | 384,426 | 94.01% | 85.89% | 63,150 | 90.12% |
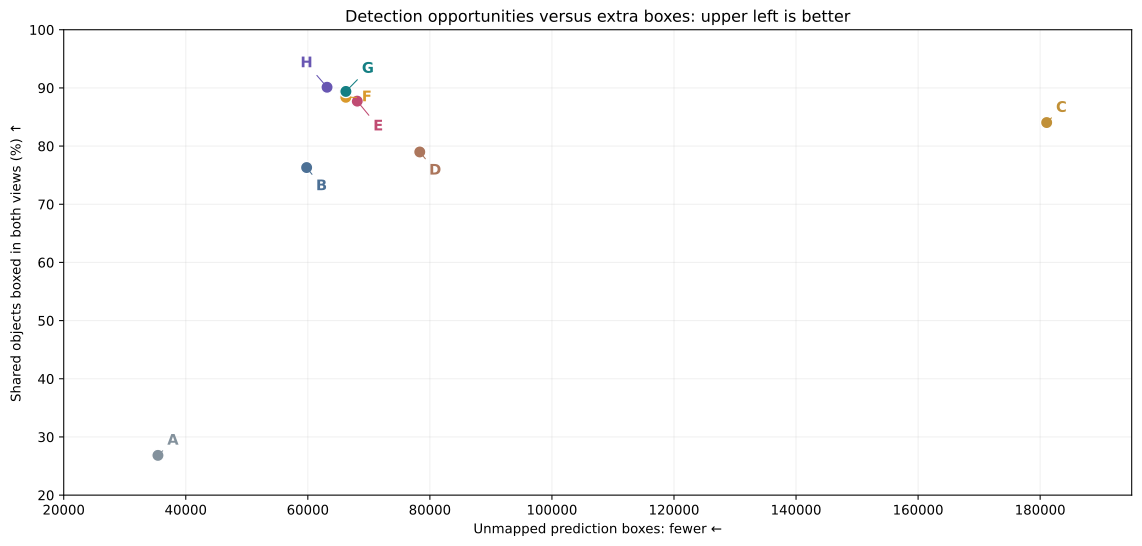
All eight rows use the same full test, a fixed confidence cutoff strictly greater than 0.25, and the same class-agnostic one-to-one box assignment rule at IoU ≥ 0.50. “Boxed in both views” uses all 1,486,614 true shared-object links. The chart shows individual tested configurations, not a threshold sweep.
The combined latest result is E → H. Recall rises from 92.45% to 94.01%; both-view coverage rises from 87.73% to 90.12%; unmapped boxes fall from 68,094 to 63,150. This is more useful coverage with fewer extra boxes.
There are 8,950 reference appearances whose shorter box side is under 32 pixels in the original photo. These are the small objects in the following table. The newest configuration finds 51.20%, compared with 45.08% for E. Almost half remain missed.
| Configuration | Small appearances found | Small-object recall |
|---|---|---|
| E · 600 / 768 | 4,035 / 8,950 | 45.08% |
| F · 600 / 1024 | 4,108 / 8,950 | 45.90% |
| G · 2,400 / 768 | 4,499 / 8,950 | 50.27% |
| H · 2,400 / 1024 | 4,582 / 8,950 | 51.20% |
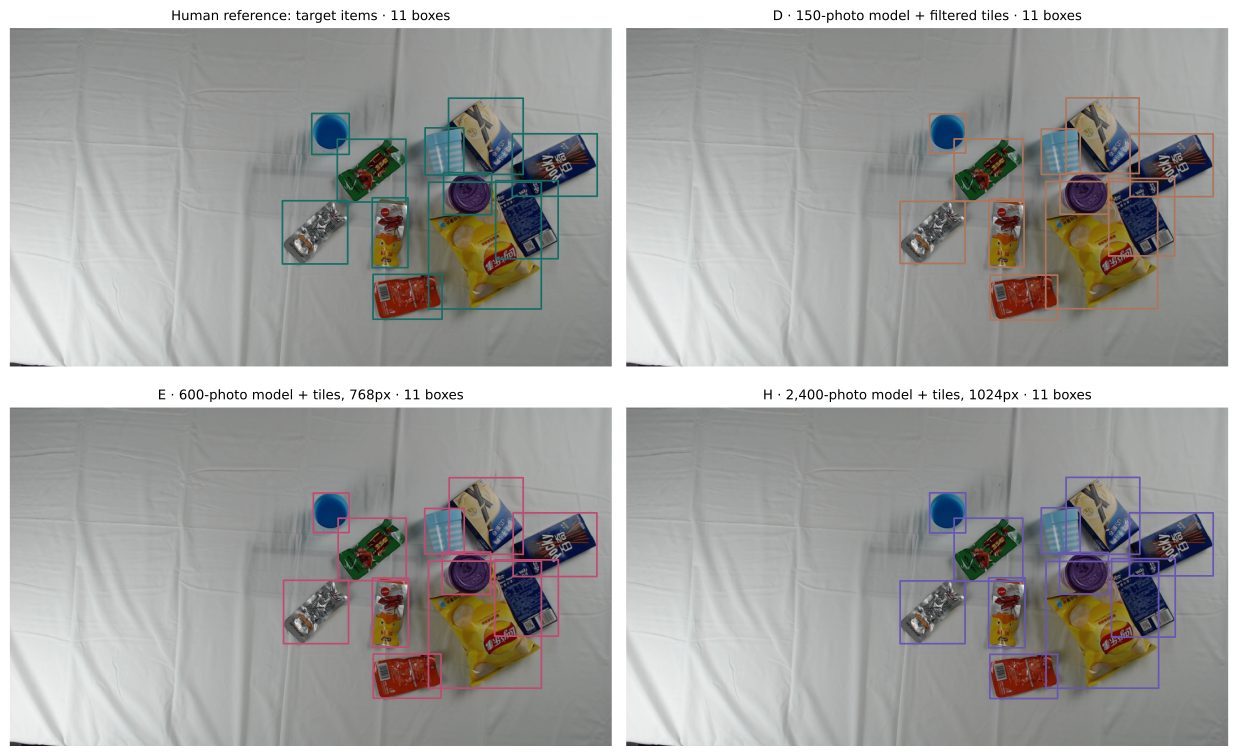
The 600- and 2,400-photo models start from the same earlier locally trained checkpoint. Each receives 3,000 additional updates, batch size four, at 1024 pixels, with a 50/50 mixture of full scenes and native 768-pixel tiles. The newer run includes the earlier 600 photos and uses 58,022 human reference boxes across 191 training setups. Its training took about 24.6 minutes.
This is a fixed-compute comparison: 3,000 updates expose 600 photos about 20 times, but 2,400 photos about five times. It is not a comparison in which both models were trained until neither could improve. We used one training seed.
The stricter IoU ≥ 0.75 check asks for more accurate box boundaries. Missed targets below use the main IoU ≥ 0.50 rule.
| Configuration | Missed human targets | Total predicted boxes | Recall at stricter overlap, IoU ≥ 0.75 |
|---|---|---|---|
| A | 252,657 | 191,720 | 35.51% |
| B | 62,955 | 405,787 | 76.99% |
| C | 40,578 | 549,429 | 81.10% |
| D | 55,205 | 432,076 | 78.66% |
| E | 30,890 | 446,141 | 85.45% |
| F | 29,134 | 446,034 | 86.89% |
| G | 26,365 | 448,810 | 87.53% |
| H | 24,511 | 447,576 | 88.88% |
The historical metric audit remains available in the evidence section. Its warning still applies: this localisation scorer maximises total eligible box overlap, not the count of covered objects. The same rule is retained for every row rather than silently changing it for newer models.
The original idea was to reuse what the model had already found: accept its strongest detections as training labels, train a new version, discover more objects, then repeat. The computer-generated labels are often called pseudo-labels. In this experiment, the “teacher” makes those labels and the “student” is the detector trained with them.
The analogy suggested a useful experiment, but object detection lacks the clear win/loss feedback of a board game. A detector’s confidence is its own estimate, not an independent answer key. Repeating a prediction does not make it correct. If a real object is omitted from the automatic labels, ordinary training may even teach the student to treat it as background.
We compared four short training continuations. They began from the same detector and received the same number of updates. One continued on trusted labels; two used automatic labels; a diagnostic used the complete human labels on the same extra photos. A separate calibration set selected confidence cutoffs to control extra and unmapped output; those cutoffs were then applied to all 100 development pairs. The results below are from that development set, not the full-test table above.
| Short training continuation | Boxed in both views | Coverage | Change vs trusted labels | 95% setup interval, points |
|---|---|---|---|---|
| Continue on trusted human labels | 1,603 / 2,173 | 73.77% | Reference | — |
| Use single-pass automatic labels | 1,607 / 2,173 | 73.95% | +0.18 points | -1.17 to +1.49 |
| Use automatic labels from several versions of each photo | 1,606 / 2,173 | 73.91% | +0.14 points | -1.10 to +1.34 |
| Use complete human labels on those extra photos | 1,605 / 2,173 | 73.86% | +0.09 points | -1.42 to +1.58 |
The automatic-label variants improved both-view coverage by only 0.18 and 0.14 percentage points over trusted-label replay. Even complete human labels on those extra photos gained just 0.09 points under that short recipe. None reached the planned three-point gain. Each uncertainty interval includes zero, meaning the data do not establish an improvement over the replay control. The intervals describe variation across setups, not variation across training seeds.
Label quality also weakened at the discovery frontier. In the preselected 240-photo audit, the single-pass automatic labels were 96.97% precise at IoU ≥ 0.50. But the 554 additional labels from the higher-resolution and grayscale passes were only 80.87% precise, dropping to 68.41% with the stricter box-overlap requirement. The labels most likely to expand coverage were less dependable than the familiar ones.
Our decision: park recursive self-labelling. It did not demonstrate a useful coverage gain under the setup we tested, and no successful repeated self-improvement cycle was completed. The later gains in this report come from human-labelled data and a stronger training recipe. They are supervised learning, not an AlphaGo-style result.
This does not show that self-training can never help. The earlier continuation used only 300 extra updates, a constant learning rate, 768-pixel inputs and a largely frozen backbone. Later supervised training changed those conditions and did improve. We have not rerun the automatic-label comparison with that stronger recipe. With thousands of human-labelled training photos still available, automatic label generation has not earned priority here.
The complete automatic-label experiment and its controls are kept in the project archive.
The detector now provides a much stronger starting point. Human-labelled adaptation was the biggest practical step. Training and predicting at useful scales improved small-object coverage, and more labelled photos improved the result further under the same update budget.
The data are large enough to describe this benchmark, but are not a fresh confirmation test. All official test setups have now been examined during this project. The native training split is excluded from evaluation, but benchmark exposure means these results should not be presented as untouched evidence of generalisation. The same physical products can recur across scene setups.
The latest training comparison has one seed and a fixed compute budget. Its exact counts are valid for these saved runs. We have not established how stable the training gain is across repeated runs, what all 16,920 training photos would achieve, or how long each model needs to reach its best result.
The findings apply to the scenes we tested. MessyTable contains everyday objects arranged on tables. Performance on other environments, object types and lighting conditions needs separate evaluation.
The next practical priorities are clear: preserve the new supervised detector as a reference; understand the remaining small-object and box-quality errors; choose the right precision/recall tradeoff for the intended workflow; and measure how the improved detector changes identity matching (Part Three) on new, representative data. Reopening recursive self-labelling would require a fresh controlled comparison against the stronger supervised recipe.
This page covers the completed YOLO studies for a wider audience. The chained detector-to-matcher evaluation is reserved for Part Three. It does not run models, train a new checkpoint, select thresholds, or change earlier experimental results. The tables and charts are built from saved result files and checked against their original denominators.
Detection metrics are pooled, class-agnostic localisation metrics, not category accuracy or threshold-integrated mAP. Predictions use confidence > 0.25. Localisation uses the existing one-to-one maximum eligible IoU-sum assignment at IoU ≥ 0.50; stricter extent recall uses IoU ≥ 0.75. Precision = localised / all predictions; recall = localised / all human appearances. An empty-output photo still contributes all its missed targets.
The latest raw tile merge preserves full-frame boxes, rejects candidates touching an artificial tile boundary within four pixels, maps coordinates back once and deduplicates at IoU 0.55. Tiles are native 768 pixels with stride 576 and edge-aligned final windows. The older D gate additionally applies confidence ≥ 0.80 and geometry checks to tile additions. E–H use the same fixed raw-merge recipe.
Historical self-training results used calibration-selected cutoffs under candidate/unmapped ceilings, then scored Development100. They are not combined with the fixed-cutoff full-test results. The complete-label control changes label completeness and background supervision together, so it does not isolate label noise alone. No repeated teacher refresh qualified.